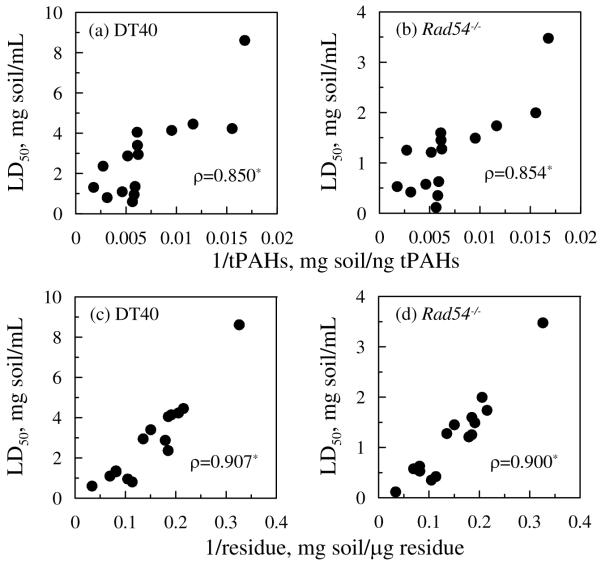
Figure 3.
Inverse correlations between LD50 and concentrations of tPAH for parental DT40 cell line (a) and its Rad54−/− mutant (b), and between LD50 and concentrations of total residue for parental DT40 cell line (c) and its Rad54−/− mutant (d). Each data point represents the mean for each soil sample (total 15 samples) including untreated column packing soil, all sampling points along each column, untreated bioreactor feed soil, and all sampling events for bioreactor-treated soil during the 7-d. Asterisks indicate the correlation is statistically significant (p< 0.05).

