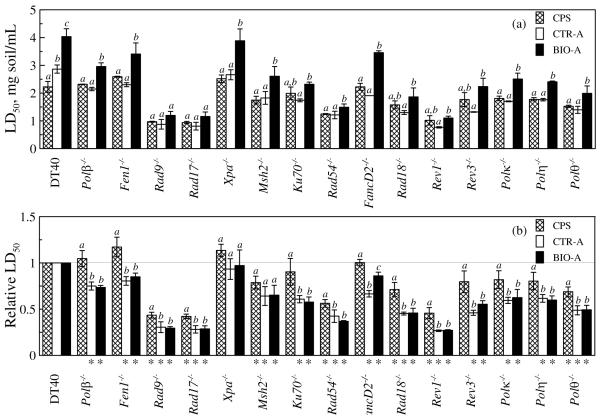
Figure 4.
LD50 (a) and relative LD50 (b) of soil before and after 2.5 year column treatment in the test with a battery of DT40 cell lines. Values are mean ± SD of three separate experiments. Different letters are assigned to conditions for which there was a significant difference (p<0.05). Asterisks indicate values significantly less than 1 (p< 0.05). CPS: untreated column packing soil; CTR-A: control-column treated soil at Port A; BIO-A: biostimulated-column treated soil at Port A.

