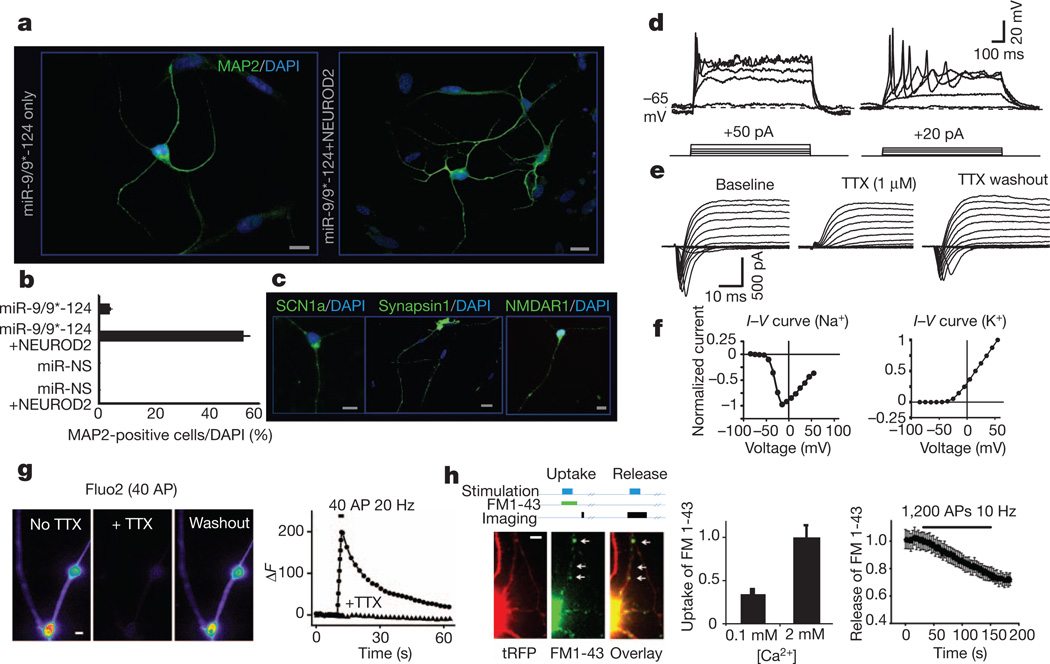
Figure 1. miRNA-induced transformation of human fibroblasts.
a, MAP2 expression in miR-9/9*-124 only (left) and miR-9/9*-124-NEUROD2 (right) converted cells. DAPI, 4′,6-diamidino-2-phenylindole. Scale bar, 20 µm. b, Quantification of MAP2-positive cells with processes at least three times the length of the cell body from ten random fields. The graph represents the percentage of MAP2-positive cells over DAPI-positive cells. miR-9/9*-124 only: n = 558; miR-9/9*-124-NEUROD2: n = 658 cells. The error bars are s.e.m. MAP2 signal was undetectable in fibroblasts infected with miR-NS, with or without NEUROD2. Scale bar, 20 µm. c, Expression of SCN1a, synapsin 1 and NMDAR1 in miR-9/9*-124-NEUROD2-converted cells. Scale bar, 20 µm. d, Representative traces of action potentials recorded in current clamp in miR-9/9*-124-NEUROD2-converted cells. Twelve out of 22 cells showed single action potentials and 2 cells showed repetitive firing. e, A representative example of a series of voltage steps applied to an miR-9/9*-124-NEUROD2-induced neuron held at−70 mV. An inward current was observed, blocked by 1 µM TTX, and reversed after TTX washout (n = 6). f, I–V curve for the peak inward (left) and outward (right) currents. g, An example of Ca2+ influx in induced neurons as measured by Fluo2-AM imaging. Images show the peak Fluo2-AM signal on stimulation before and during TTX application, and after TTX washout, respectively. The graph represents the changes in Fluo2 signal over time (circles, no TTX; triangles, with TTX). AP, action potential. Field stimulation is indicated by the black bar. Scale bar, 2 µm. h, An example of vesicle recycling measured by FM1-43 imaging in induced neurons. Top diagram illustrates the protocol of FM uptake or release experiments. The images represent the typical FM1-43 dye uptake signal (middle) in a converted cell marked by tRFP (left). The left graph shows the measurement of FM1-43 loading in 2 mM Ca2+, which was significantly reduced in low Ca2+ concentration (0.1 mM). The right graph quantifies FM1-43 release (destaining) during stimulations. FM1-43 signal was measured from n > 600 boutons (arrows indicate examples of boutons) from 4 cultures. All error bars are s.e.m. In some cases, the s.e.m. is too small to be resolved. Scale bar, 4 µm.

