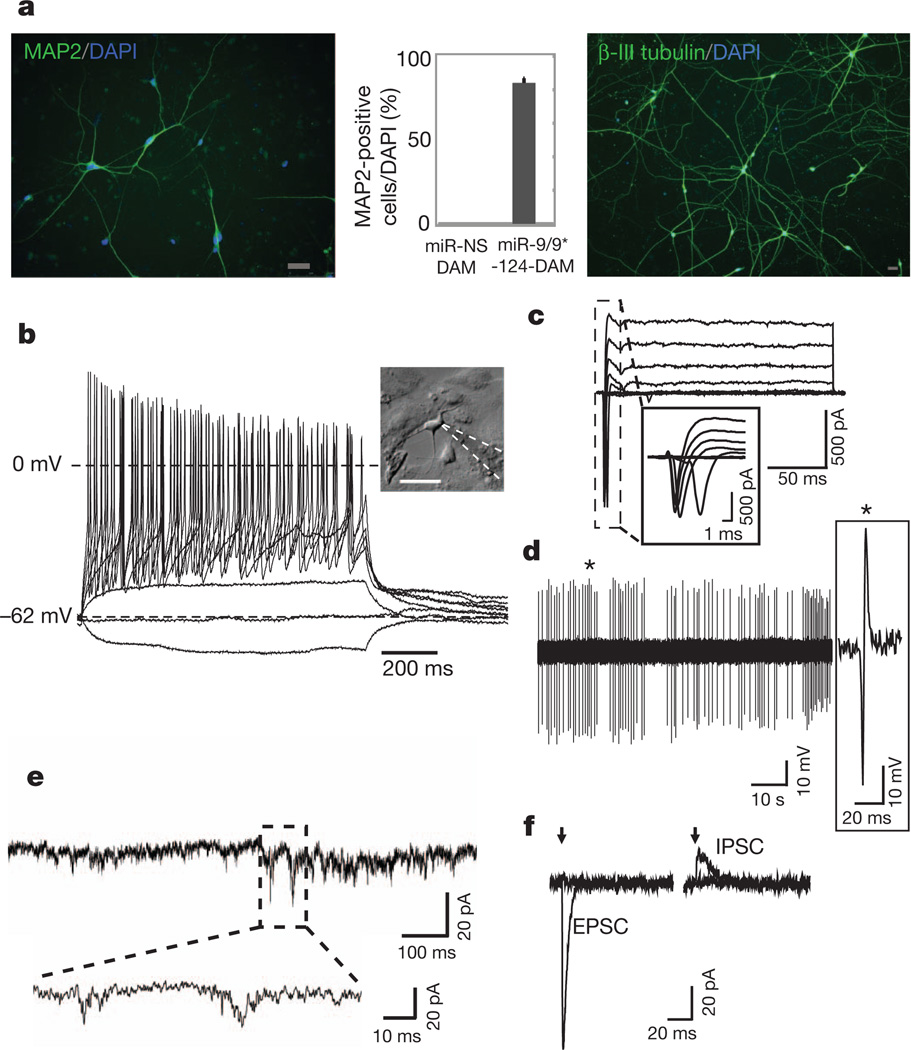
Figure 2. Additional neural factors enhance the conversion to neurons.
a, MAP2 (left) and β-III tubulin (right) immunostaining of miR-9/9*-124-DAM-converted cells. Scale bar, 40 µm. The graph represents the percentage of MAP2-positive cells over DAPI-positive cells. The error bars are s.e.m.; n = 150 cells. b, A representative current clamp recording from a cell with typical neuronal morphology (see inset; scale bar, 50 µm). Voltage deflections were elicited by somatic current injections of various amplitudes (Δ = 5 pA). c, A representative voltage clamp recording of the net current at various membrane potentials (−40 to +20 mV, ΔV = 10 mV, Vhold = −90 mV). d, A representative trace of spontaneously active cells recorded in cell-attached mode. e, A representative trace demonstrating spontaneous EPSCs. f, Representative traces of evoked postsynaptic currents (left, EPSC; right, IPSC) obtained in response to local field stimulation with single current pulses (1 ms) of various amplitudes (left, 0.25 and 0.3 mA; right, 0.3 and 0.4 mA) at different membrane holding potentials (left, −70 mV; right, 0 mV). The arrows indicate the time when stimulation was applied. Stimulation artefacts were eliminated for clarity.

