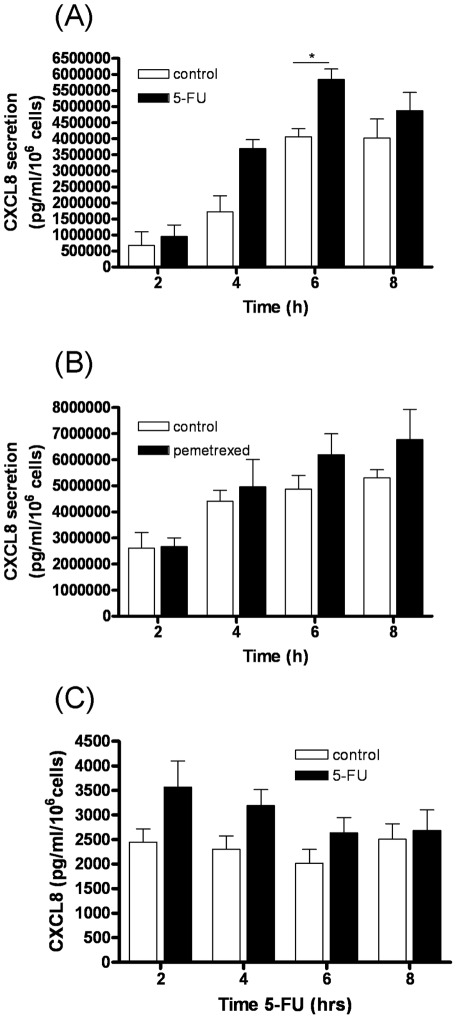
Figure 1. Effects of anti-metabolite agents upon CXCL8 secretion from prostate cancer cells.
(A) Bar graph plotting the level of CXCL8 secretion following treatment of PC3 cells with 1 µM 5-FU. Values shown are plotted relative to a time-matched control and represent the mean ± S.E.M. of three independent experiments. (B) As in A, except that cells were treated with 1 µM pemetrexed. Differences in CXCL8 expression between time-matched control and drug-treated samples were analyzed by a two-tailed Student's t-test; *, p<0.05. (C) Bar graph plotting the levels of CXCL8 secretion following treatment of LNCaP cells with 1 µM 5-FU. Values shown are plotted relative to a time-matched control and represent the mean ± S.E.M. of three independent experiments.

