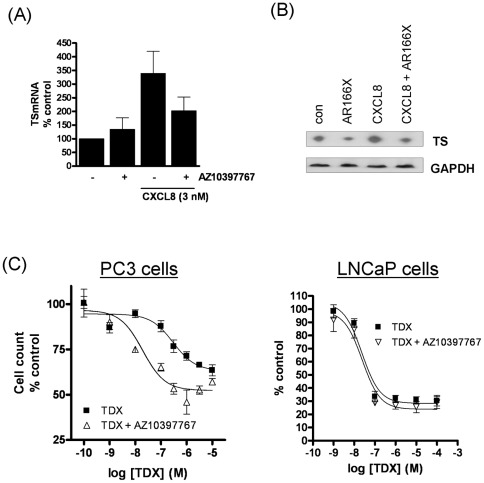
Figure 5. Inhibition of CXCR2 signaling represses TS expression and sensitizes the response to Tomudex.
(A) Bar graph illustrating the effect of the CXCR2 inhibitor on the CXCL8-promoted increase in TS transcript levels in PC3 cells as detected by qPCR analysis. The inhibitor was added overnight and cells stimulated with 3 nM rhCXCL8 for 8 h. (B) A representative immunoblot illustrating the impact of the CXCR2 inhibitor AZ10397767 upon the expression of TS in unstimulated and CXCL8-stimulated conditions. AZ10397767 was added overnight and cells stimulated with 3 nM rhCXCL8 for 8 h. (C) Graph illustrating the cell count assay data, determined from the treatment of PC3 cells (left panel) and LNCaP cells (right panel) with increasing concentrations of Tomudex, in the absence or presence of the CXCR2 receptor antagonist, AZ10397767. Cell counts were taken 72 hours post-treatment with the anti-metabolite. Cell count data was analyzed using the non-linear regression function of GraphPad Prism, using a sigmoidal one-site curve fit equation. AZ10397767 was administered at a final concentration of 20 nM in all experiments. Data points shown are the mean ± S.E.M. value of three independent experiments; *p<0.05; **p<0.01.

