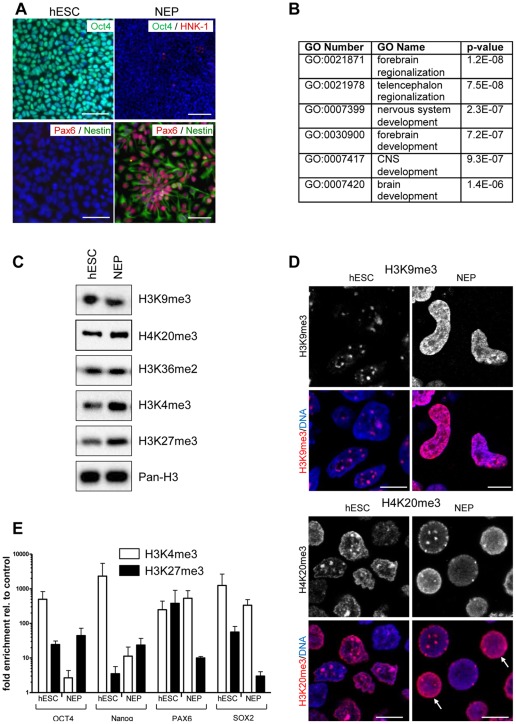
Figure 1. Effect of neuroectodermal differentiation on localization of histone marks.
(A) hESC were differentiated towards NEP and stained with antibodies specific for Oct4, HNK-1 (neural crest marker), Pax6 (NEP marker) and nestin (neural stem cell marker). Nuclei were stained with the DNA dye H-33342 (blue). Scale bars: 100 µm. (B) GO analysis of the up-regulated genes in NEP compared to hESC (C) Whole cell extracts from hESC and NEP were analyzed by Western blot with antibodies specific for the indicated histone H3 modifications. Total histone H3 (Pan-H3) was used as loading control. (D) hESC and differentiated NEP were grown on glass cover slips and immunostained with antibodies specific for H3K9me3 or H4K20me3. The upper panels show grey-scale signal intensities of the stain, the lower panels show a superimposition of the same histone stain as above (red) with a DNA counter-stain (DAPI, blue). Arrows mark two cells with a diffuse H4K20me3 stain, which differs from the spot-like pattern always observed in hESC. Scale bars: 10 µm. (E) Chromatin immunoprecipitiation was perfomed from nuclei of hESC or NEP with antibodies specific for H3K4me3 and H3K27me3. The abundance of promoter regions of OCT4, NANOG, PAX6 and SOX2 was measured by qPCR with specific primers for the indicated genes. Data were compared to control samples prepared without specific antibody and are indicated as relative enrichment. Data are means ± SD from 2 experiments.

