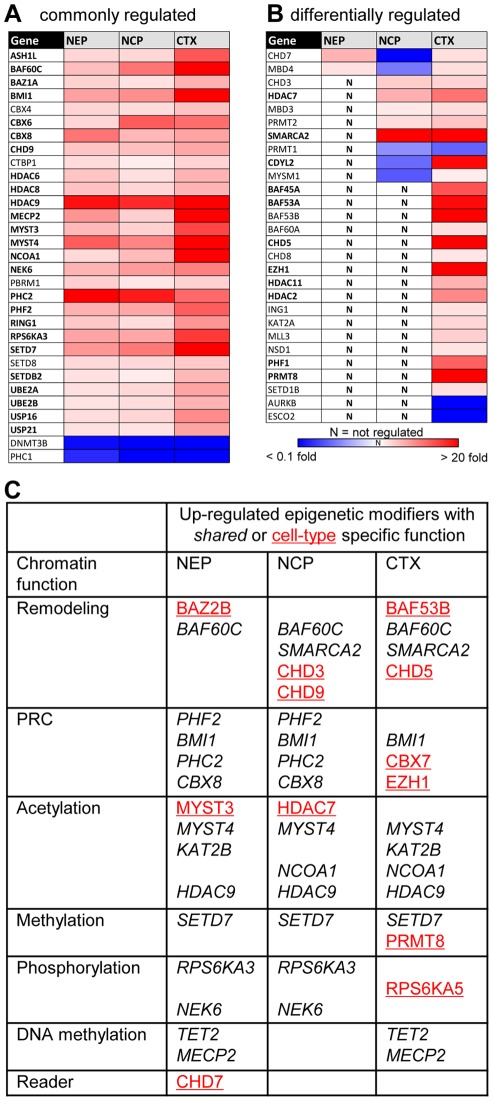
Figure 6. Comparison of epigenetic modifiers in cortical neurons with early neural precursors.
The levels of epigenetic regulator gene transcripts were measured as in Fig. 5, but samples from human cortex (CTX) were included. Up-regulated genes are displayed in red, down-regulated transcripts in blue, as indicated by the chromatic scale. Genes with CTX transcript levels 5 times higher than in hESC are indicated in bold letters (A) Display of all genes regulated into the same direction in early neural precursors and mature neurons. (B) Differentially regulated genes. Measures of variance and p-values are indicated in the supplemental material. (C) Summary of the most up-regulated common (italics) or cell type-specific (red, underlined) chromatin modifier genes, sorted according to their function.

