Figure 4.
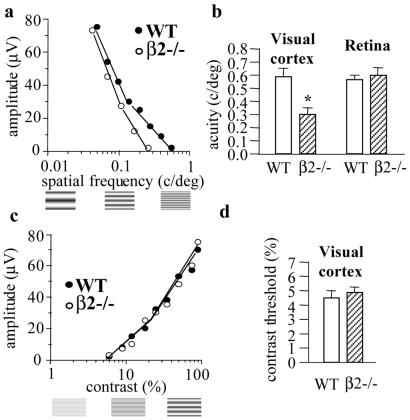
(a) Representative examples of VEP amplitude changes in response to gratings of high contrast and of decreasing bar size (increasing spatial frequency) in a wild-type (WT) and a β2−/− mouse. VEP amplitude decreases by progressively increasing the spatial frequency. Visual acuity was determined by linearly extrapolating VEP amplitude to 0 V, the set of data points close to the noise level. Examples of gratings of increasing spatial frequency are shown below the abscissae. (b) Spatial resolution in the visual cortex and in the retina of wild-type and β2−/− mice. Visual acuity is significantly reduced in β2−/− mice compared with wild-type mice at the cortical (β2−/−, 0.30 ± 0.05 c/degrees, n = 9; WT, 0.59 ± 0.08 c/degrees, n = 4; *, P < 0.01, Student's t test) but not at the retinal level (β2−/−, 0.60 ± 0.07 c/degrees, n = 3; WT, 0.57 ± 0.04 c/degrees, n = 3; P > 0.05, Student's t test). Bars represent mean ± SEM. (c) Representative examples of VEP amplitude changes in response to coarse gratings (0.06 c/degrees) of decreasing contrast. VEP amplitude decreases by progressively reducing the contrast. Contrast threshold was determined by linear extrapolation of VEP amplitude to 0 V, the set of data points close to the noise level. Examples of gratings of increasing contrast are shown below the abscissae. (d) Contrast threshold is normal in β2−/− mice compared with wild type (β2−/−, 4.8 ± 0.3%, n = 4; WT, 4.6 ± 0.5%, n = 3; P > 0.05, Student's t test). Bars represent mean ± SEM.

