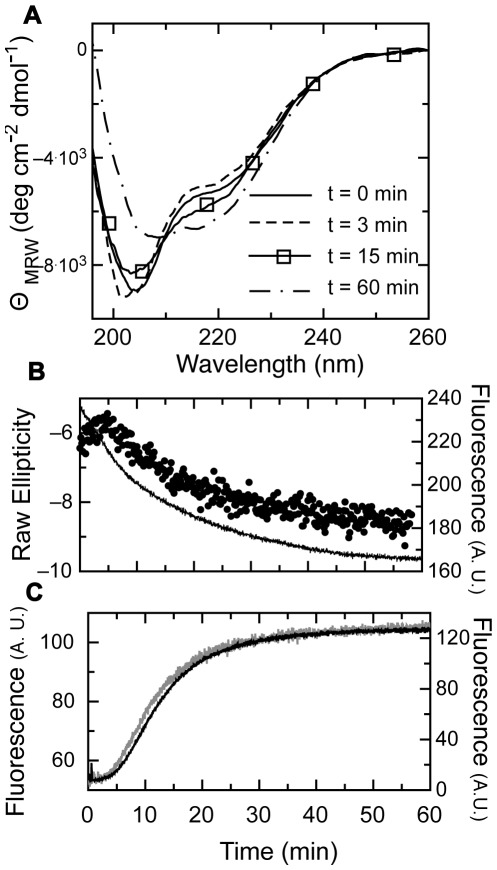
Figure 1. Assembly Kinetics of E7SOs followed by different spectroscopy probes.
(A) CD spectra obtained at different times during E7SOs assembly. CD spectrum of E72 before addition of EDTA (full line) and CD spectra of E7 at different times after EDTA addition, at 3 minutes (dashed line), 15 minutes (full line with rectangles) and at 60 minutes (dashed and dotted line). (B) Kinetics of E7SOs assembly monitored by circular dichroism and tyrosine fluorescence. Far-UV CD at 216 nm (black circles) and tyrosine fluorescence (full line); both experiments were carried out at the same protein concentration and triggered by the addition of 1.0 mM EDTA. (C) Kinetics of E7SOs assembly followed by Thioflavin T fluorescence (black line) and ANS fluorescence (grey line); both experiments were carried out at the same protein concentration and triggered by the addition of 1.0 mM EDTA right before beginning the measurement.

