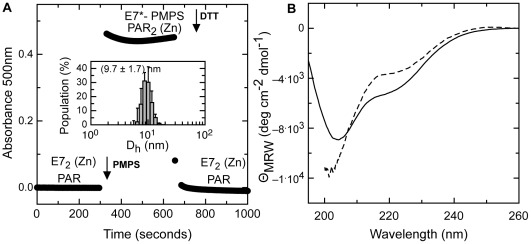
Figure 4. Evaluation of cysteine blocking and Zn release effect on E7 conformation and oligomerization state.
(A) Analysis of zinc release from the high affinity coordination center of E7 followed at 500 nm by the formation of Zn(PAR)2 complex (black circles). The addition of PMPS and DTT is indicated by arrows. Inset, size distribution profile of E7-PMPS measured by DLS. (B) CD spectrum of E7 (black line) and CD spectrum of E7 upon addition of PMPS (dashed line).

