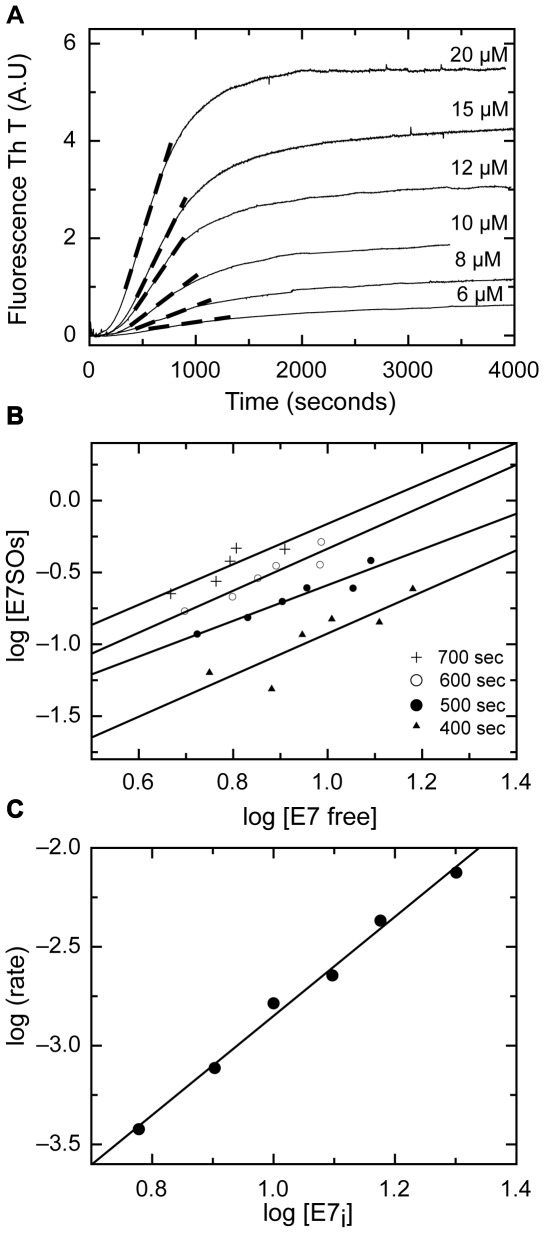
Figure 5. Kinetics of E7SOs assembly at different initial E7 concentration.
(A) The assemblies of E7SOs at the indicated protein concentrations were monitored by ThT fluorescence. The rates of the elongation phase were estimated from the slope of dashed lines. (B) Determination of the nucleus size. Based on the KL model, the nucleus size n is calculated by averaging four slopes obtained from the log-log plots of the E7SOs versus E7 free molar concentration for different single time points as described in material and methods. According to this model, the observed nucleus size was 1.2±0.2. (C) Determination of the reaction order of elongation phase. The reaction order of E7SOs assembly was calculated of the power dependence of the rate of the elongation phase with the E7 initial concentration. The slope of the log-log plot 2.3±0.3 determines the elongation reaction as second order reaction.

