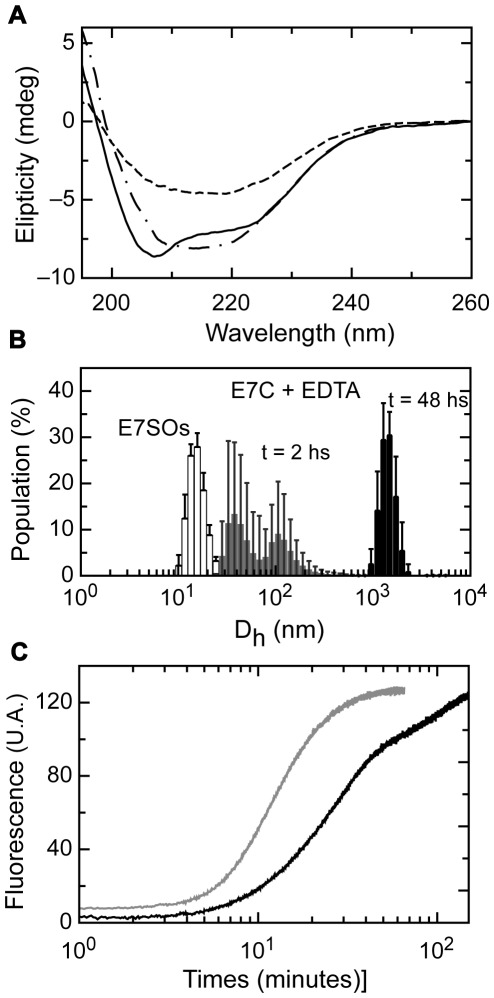
Figure 6. Oligomerization properties of E7C.
(A) CD spectra of E7C (full line), E7C protein after 2 hours (broken and dotted line) and overnight incubation (broken line) with EDTA. (B) Size distribution measured by DLS. The distribution profiles correspond to: E7SOs (white bars), E7C incubated 2 hours with EDTA (grey bars) and E7C incubated 24 hours with EDTA (black bars). (C) Kinetic measurement of the oligomerization assembly after the addition of EDTA monitored by Thioflavin T fluorescence. E7C oligomerization kinetic (black full line) and E7SOs kinetic formation (grey full line). The time axis is in a log scale.

