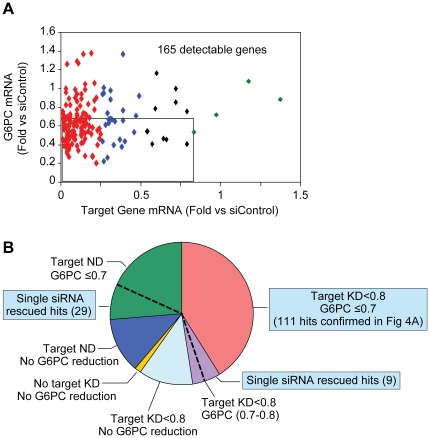
Figure 4. Confirmation of primary screen hits by 2 distinct siRNA assays.
A. Pooled siRNA knockdown of 165 Taqman-detectable primary hits vs. reduction of G6PC mRNA expression as determined by Taqman qPCR analysis. Data are shown as fold change compared to mRNA expression in siControl-transfected cells and are the means of a study performed in triplicate. The square contains 111 primary hits that reduce G6PC and target gene expression by ≤0.7- and ≤0.8-fold, respectively. Red, blue, black, and green dots represent target gene knockdown by <0.25-fold, between 0.25-fold to 0.5-fold, between 0.5-fold to 0.8-fold, and no knockdown, respectively. B. Schematic diagram for the 270 primary screen hits separated into different categories after target gene knockdown study. Red represents the 111 hits identified above in A. Blue, orange, and light blue represent primary hits that were not confirmed due to lack of G6PC knockdown. Sets of 7 distinct single siRNAs to each of the 270 primary screen hits were tested for their ability to diminish G6PC expression using the 4-gene HTG platform to quantify mRNA levels. Any target gene for which ≥2 single siRNAs reduced G6PC mRNA was deemed “rescued”. This assay rescued 9 primary hits whose siRNA knocked down their target gene mRNA but only reduced G6PC mRNA between 0.7- to 0.8-fold (purple) and 29 primary hits that were undetectable by Taqman analysis in the pooled siRNA confirmation assay described in A, but were detectable using enriched cDNA as describe in the “Results” section (green). The blue squares label the gene subsets that were combined to become our final 149 confirmed hits using the confirmation strategy described here. ND: undetectable by Taqman analysis; KD: knockdown.

