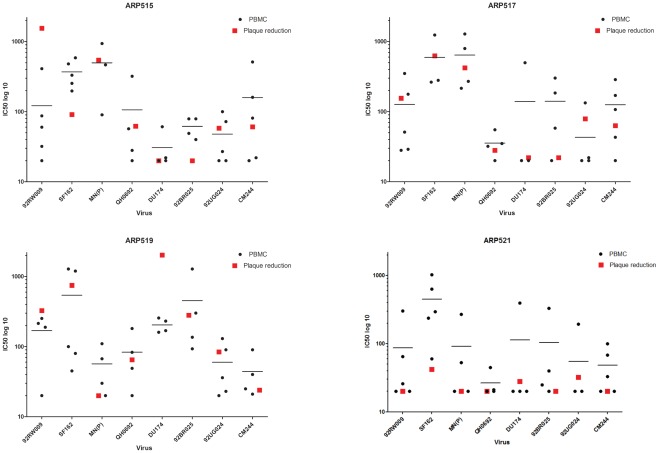
Figure 5. Comparison of PBMC assay with the automated readout of the plaque reduction assay.
Plaques, identified as GFP-expressing cells, were evaluated by use of an AxioVision Z1 Microscope with automated reading platform. The 96-well plates were screened through with illumination time of 200 ms throughout experiments. To reduce auto fluorescence, medium was removed and PBS was gently added pre-microscopy. Plaque quantity was measured with CellProfiler software ( [32] (www.cellprofiler.org), version r10997. Image analysis was performed using fifteen 5× mosaic images per well. Results presented are the means of 2–3 experiments. Black dots, IC50 obtained by individual laboratories in the PBMC assay; red squares, IC50 obtained in the plaque reduction assay.

