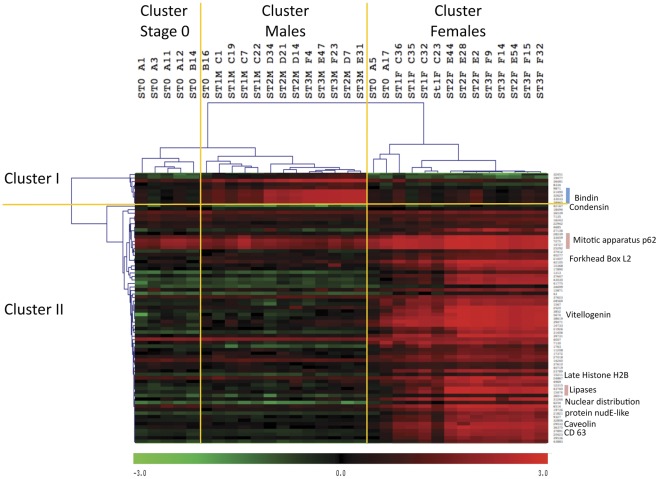
Figure 2. Heat map of sex specific genes.
Hierarchical clustering obtained using Pearson’s correlation on the 77 genes differentially expressed in males and females (T test, p<0.01, adjusted Bonferroni’s correction, rows) and on all individual gonad samples (columns). Three sample branches are observed, mainly clustering stage 0 individuals, males, or females. Two gene branches are observed, clustering genes more expressed in males (cluster 1∶9 genes) or in females (cluster 2∶68 genes). Color represents the transformed normalized Cy3 log value obtained for each sample. The variations in transcript abundance are depicted with a color scale, in which shades of red represent higher gene expression and shades of green represent lower gene expression. St3: stage 3; St2: stage 2; St1: stage 1; St0: stage 0.

