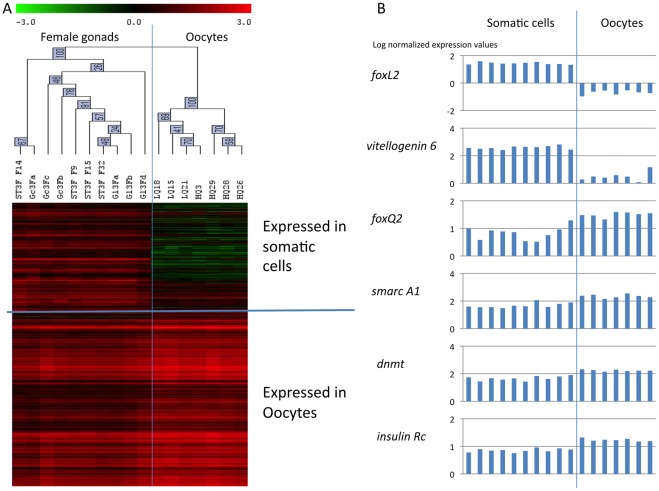
Figure 4. Germ cell versus somatic gene expression.
A/Hierarchical clustering obtained using Pearson’s correlation on the 434 genes differentially expressed in stage 3 females gonads and stripped stage 3 oocytes (T test, p<0.01, adjusted Bonferroni’s correction; rows) and on the 17 transcriptomic profiles of stage 3 female gonads (columns). Two sample branches are observed, clustering the 4 individual stage 3 female gonads (St3F) and the 6 pools of stage 3 female gonads (Gl3F for individuals from site 1 and Gc3F for individuals from site 2) together on a first and the 7 stripped stage 3 oocytes (LQ and HQ) together on a second branch. Two clusters of genes are observed, grouping genes more expressed in whole stage 3 female gonads apart from genes more expressed in stripped stage 3 oocytes. Genes more expressed in whole stage 3 female gonads are predicted to be expressed by somatic tissues, in contrast with genes significantly more expressed in stripped oocytes. Color represents the transformed normalized Cy3 log value obtained for each sample. The variations in transcript abundance are depicted with a color scale, in which shades of red represent higher gene expression and shades of green represent lower gene expression. B/Expression profiles of 2 genes expressed in somatic cells: forkhead box L2 (foxL2) [Genbank AM860211] and vitellogenin 6 [Genbank AB084783]; and of 4 genes expressed in oocytes: forkhead box Q2 (foxQ2) [Genbank AM865563], SWI/SNF-related matrix-associated actin-dependent regulator of chromatin A1 (smarc A1) [Genbank AM869433], DNA methyltransferase (dnmt) [Genbank CU994437], and insulin receptor (insulin Rc) [Genbank AJ535669] as measured by microarray analysis. A and B/Microarray data are expressed in log center reduced normalized values.

