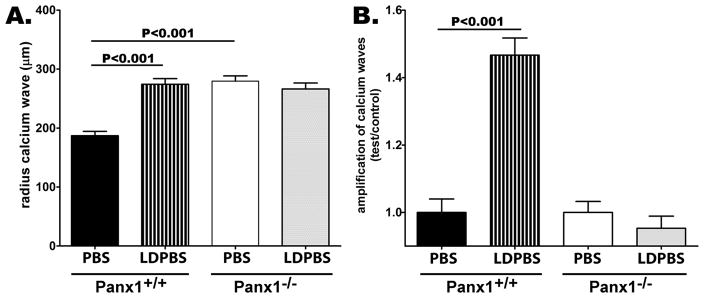
Figure 6. Impaired calcium wave amplification in cultured Panx1−/− astrocytes.
(A) Bar histogram of the mean ± s.e.m. values of the radius of calcium wave spread between confluent cultures of Panx1+/+ and Panx1−/− astrocytes bathed in divalent containing phosphate buffered solution (PBS) and in low divalent (LDPBS) solutions. Part (B) shows the amplification of calcium waves measured as the fold changes in radius of calcium wave spread recorded in Panx1+/+ and Panx1−/− astrocytes exposed to LDPBS normalized to that obtained from the same cells bathed in PBS. P values were obtained by ANOVA analysis of variance followed by Tukey’s multiple comparison tests. Values were obtained from 30–50 independent experiments performed on at least three different litters of each genotype.

