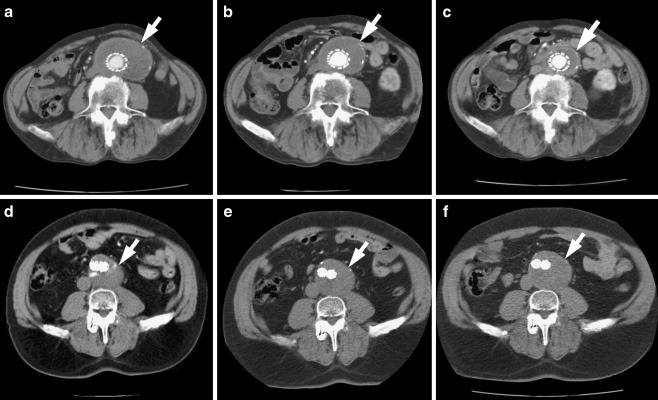
Fig. 1.
CTA images of two patients treated with EVAR. Top row favourable evolution—a 1 year after treatment, b 2 years after treatment, and c 3 years after treatment. Bottom row unfavourable evolution—d 1 year after treatment, e 2 years after treatment, and f 3 years after treatment. White arrow points aneurysm sac in all of the scans

