Figure 3.

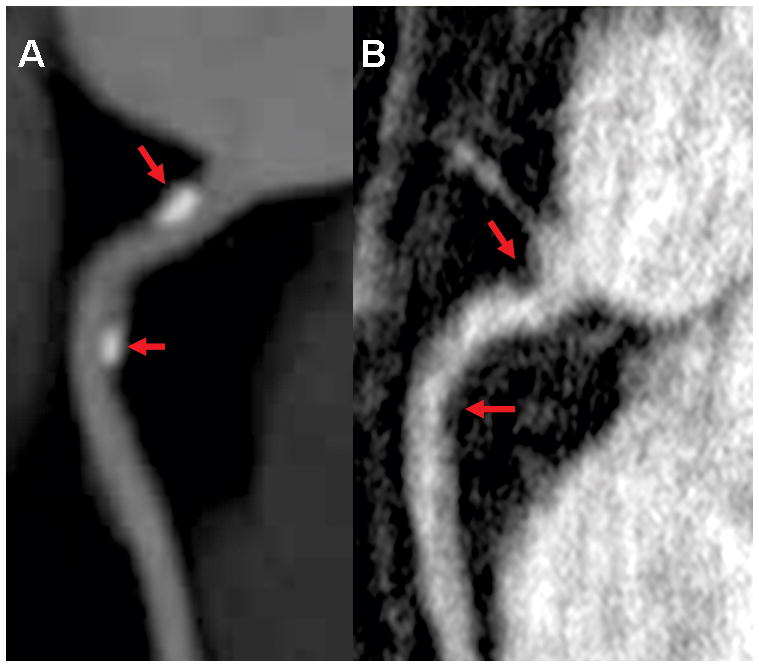
Images with mild stenosis red arrows involving RCA. A. maximum intensity projection (MIP) in right anterior oblique view of the RCA reformatted from 64-detectors CT. B. Multiplanar reformatted image of HRC MRA in the same view.

Images with mild stenosis red arrows involving RCA. A. maximum intensity projection (MIP) in right anterior oblique view of the RCA reformatted from 64-detectors CT. B. Multiplanar reformatted image of HRC MRA in the same view.