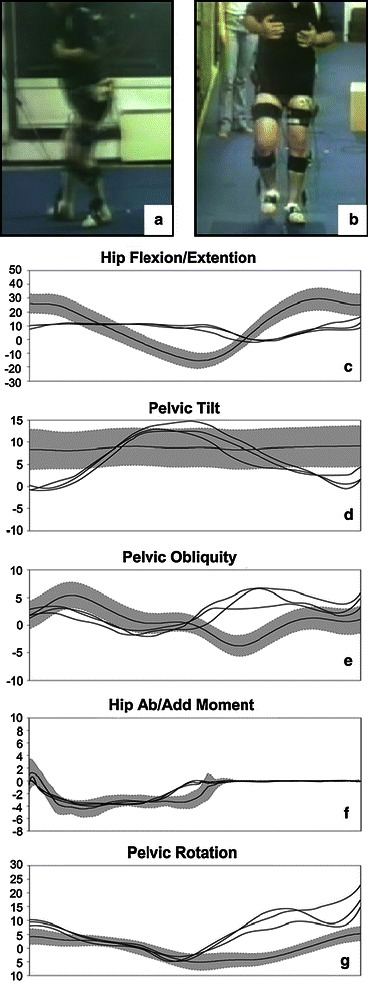
Fig. 3.

Data of patient 4 are reported (a–b), respectively hip flexion/extension (c), pelvic tilt (d), pelvic obliquity (e), hip adduction/abduction external moment (f), and pelvic rotation (g). The grey band represent the control data (mean ± 1SD, IOR Laboratory data), the black lines are relative to three gait trials of the left operated side
