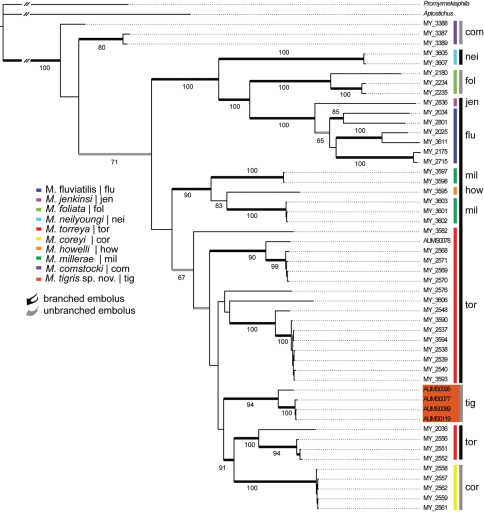
Figure 2.
Preferred tree topology based on Bayesian analysis of the 12S/16S mitochondrial DNA data set. Color key and three-letter identifiers (inset) refer to species defined by Bond and Platnick 2007 along with the new species, Myrmekiaphila tigris, described in this study and palpal bulb condition (one-pronged vs. two-pronged). Thickened black branches indicated posterior probabilities > 0.95; gray branches denote values of 0.90–0.95. Numbers at nodes are bootstrap percentages from the maximum likelihood analysis conducted in RAxML.

