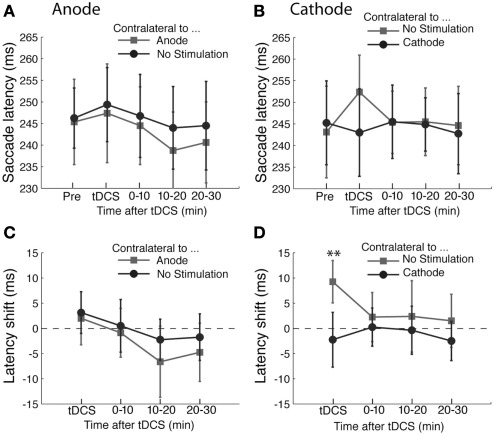
Figure 3.
Effects of tDCS in the antisaccade task. (A,B) The mean saccade latency is plotted as a function of the time course for the (A) anodal only and (B) cathodal only conditions. (C,D) Shifts in saccade latency from the baseline condition before tDCS are plotted as a function of time from the beginning of tDCS blocks for saccades. In (A) and (C), the light gray squares represent the latency of saccade contralateral to the anode and the dark gray circles the latency contralateral to the unstimulated side. In (B) and (D), the light gray squares represent the latency of saccade contralateral to the unstimulated side and the dark gray circles the latency contralateral to the cathode. The error bars correspond to one standard error of the mean (S.E.M.). Asterisks (*p < 0.05 and **p < 0.01) indicate main effects of saccade direction with respect to stimulation site (D) and the significantly different pairs revealed by a post hoc two-tailed t-test with Bonferroni correction.

