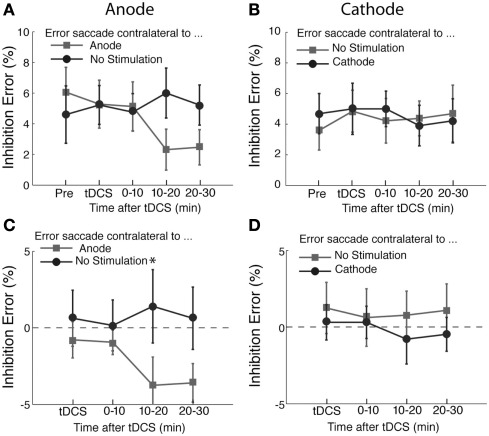
Figure 4.
Effects of tDCS on inhibition errors in the antisaccade task. The percentage of inhibition trials in which subjects made an error saccade toward the visual cue. In (A) and (C), the light gray squares represent the percentage of errors of making saccade to the visual cue contralateral to the anode and the dark gray circles the percentage of error saccades to the visual cue contralateral to the unstimulated side. In (C), the data shown in (A) was replotted after subtracting the pre-tDCS baseline to highlight changes induced by tDCS. In (B) and (D), the changes of the error rates from the pre-stimulation blocks are shown in the same format as (A) and (C). In (D), the data shown in (B) was replotted after subtracting the pre-tDCS baseline to highlight changes induced by tDCS. The error bars correspond to one standard error of the mean (SEM). Asterisks (*p < 0.05 and **p < 0.01) indicate the significantly different pairs revealed by a post hoc two-tailed t-test with Bonferroni correction.

