
Figure 3.
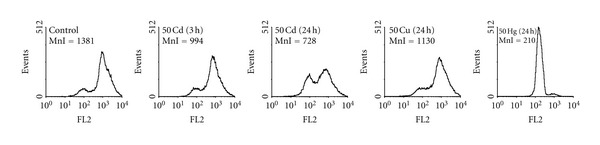
Effects of Cd2+, Cu2+, and Hg2+ on mitochondrial membrane potential of PC12 cells monitored by flow cytometry after staining the cells with the lipophilic cationic probe TMRM. MnI—mean intensity of fluorescence (arbitrary units) is indicated in the upper left corner of each panel. A typical experiment out of at least three independent ones for each metal is shown. For other details, see Section 2.