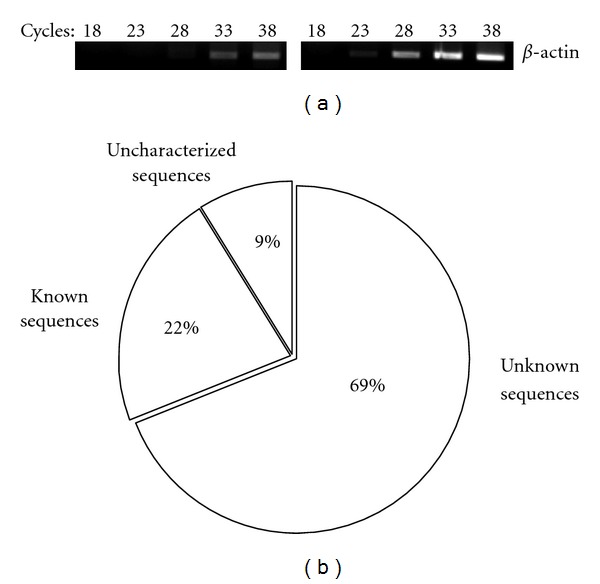
Figure 1.

Subtraction efficiency verification and characterization of ESTs. (a) Subtraction efficiency was estimated by polymerase chain reaction (PCR) amplification of β-actin gene on subtracted and unsubtracted cDNA libraries. The number of PCR cycles is indicated above each lane. (b) EST classification represented in subtracted library based on sequence analysis of 117 nonredundant inserts. Known sequences exhibit significant homology with known genes. Uncharacterized sequences were homologous to unannotated EST sequences. Sequences with no significant match were called unknown sequences.
