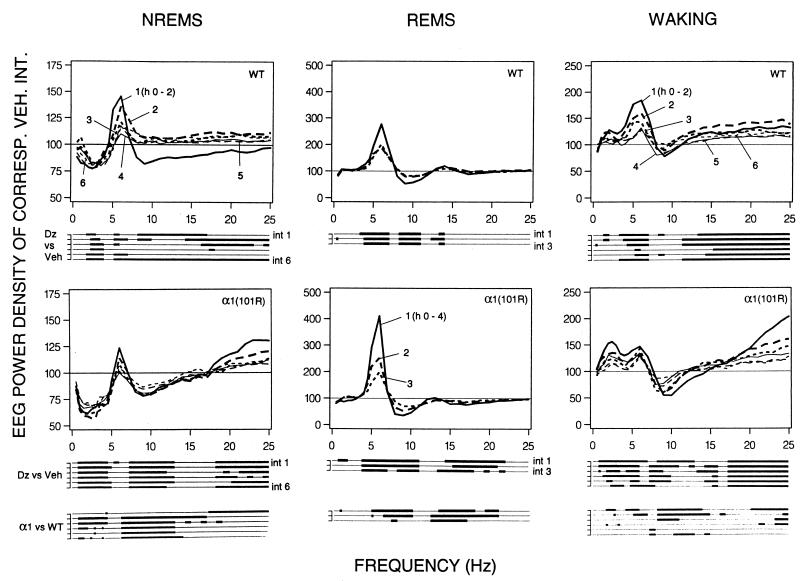
Figure 2.
EEG power density in NREM sleep (NREMS), waking, and REM sleep (REMS) for consecutive 2-h or 4-h intervals (numbers 1–6, 2-h intervals 1–6 and numbers 1–3, 4-h intervals 1–3, respectively) after Dz (3.0 mg/kg) for wild-type (WT, n = 8) and [α1(H101R), n = 7] mice. Curves connect mean values of power density of each frequency bin expressed as % of the corresponding bin and interval after Veh treatment (Veh = 100%). Values are plotted at the upper limit of each bin. Lines below the panels indicate frequency bins that differed between Dz (after significance was reached in two-way ANOVA for repeated measures) and corresponding bins after Veh (P < 0.05; two-tailed paired t test), or between α1(H101R) and wild-type mice in the effect of Dz treatment (P < 0.05; unpaired t test). No differences in EEG power density were observed between genotypes after Veh.

