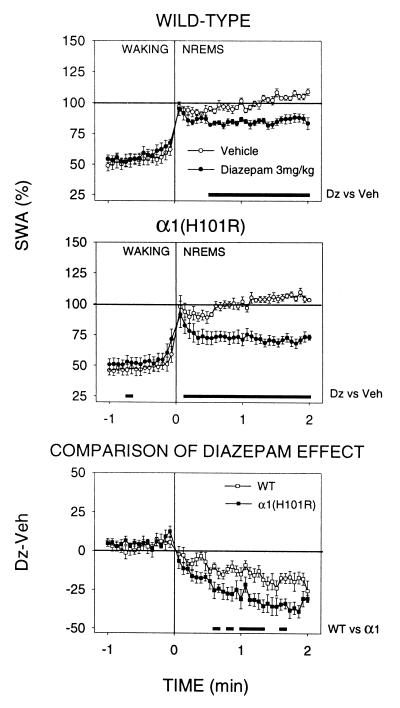
Figure 4.
(Top and Middle) SWA (EEG power 0.75–4.0 Hz) at the waking-NREM sleep transition after Veh and Dz treatment. Mean values [n = 8 wild type, n = 7 α1(H101R)] for 4-s epochs during 1 min of waking before the transition (Time 0) and 2 min NREM sleep after the transition. SWA is expressed as % of the individual 12-h value of SWA in NREM sleep after Veh treatment. The number of transitions was similar for both genotypes and for Veh and Dz (mean values ± SEM between 36.4 ± 1.2 and 41.4 ± 1.2). (Bottom) The curves represent the difference of SWA between corresponding epochs of Veh and Dz treatment for the two genotypes. Lines above the abscissae: differences between corresponding 4-s epochs of Veh vs. Dz treatment or wild type vs. α1(H101R); P < 0.05, paired t test or unpaired t test, respectively.

