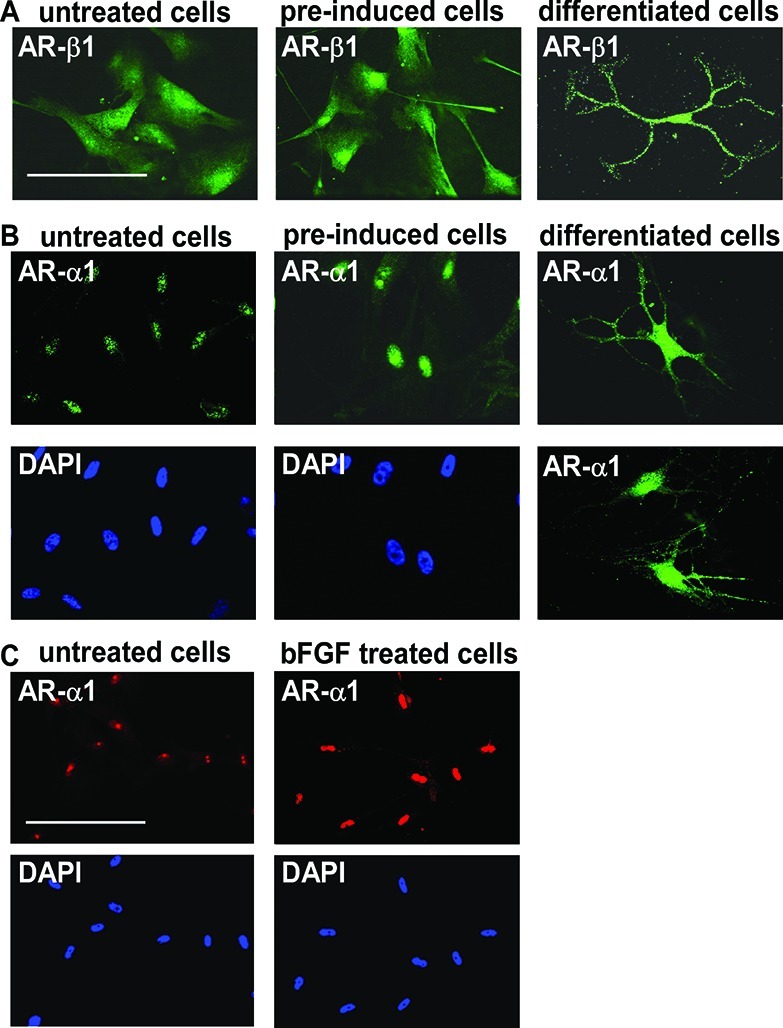
Figure 6.

Expression of α1- and β1-ARs. (A) Positive staining for β1-ARs in undifferentiated cells, cells preinduced for 24 h with bFGF, EGF, and PDGF-AA, and cells after differentiation for 30 days. The scale bar is 100 μm. (B) Nuclear expression of α1-ARs in undifferentiated cells, intensive nuclear staining in cells preinduced for 24 h with bFGF, EGF, and PDGF-AA, and surface expression after differentiation for 30 days. (C) Nuclear expression of α1-ARs in undifferentiated cells and evidence of a significant increase in staining intensity after treatment with bFGF alone for 24 h. Scale bars are 100 μm (40× magnification).
