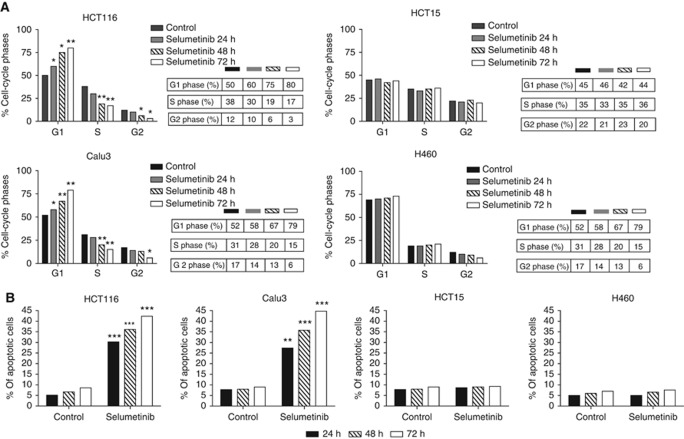
Figure 2.
Effects of selumetinib treatment on cell-cycle distribution (A) and on apoptotic induction (B). HCT116, HCT15, Calu3, and H460 were treated with selumetinib (0.25 μℳ for HCT116, 0.05 μℳ for Calu3, and 10 μℳ for both HCT15 and H460) for 24, 48, and 72 h. (A) Flow cytometric analysis of cell-cycle distribution was performed as described in Materials and Methods. Percentages of cells in G1, S, and G2 phases of the cell cycle are shown. (B) Apoptosis was evaluated with Annexin V staining, as described in Materials and Methods. The rate of apoptosis was expressed as a percentage of the total cells counted. Columns, means of three independent experiments; *P<0.05; **P<0.005; ***P<0.0005.

