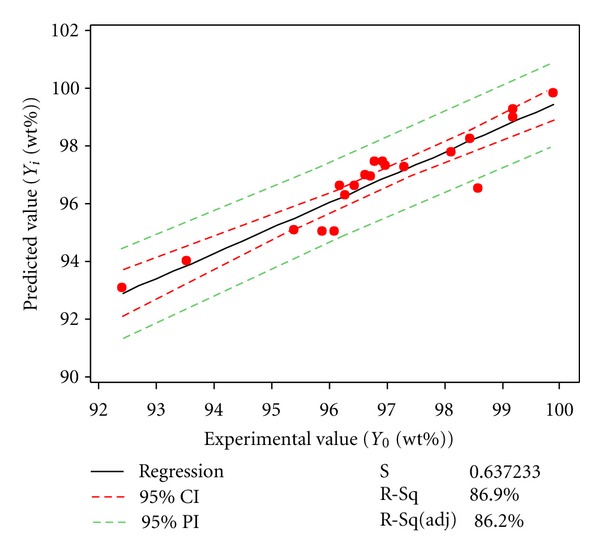
Figure 2.

The fitted line plot indicating the correlation between the predicted and experimental (Y 0) values of methyl esters (biodiesel) content. Fitted line plot for transesterification yield. Predicted value (Yi, %wt) = 11.99 + 0.8754. Experimental value (Y0, %wt).
