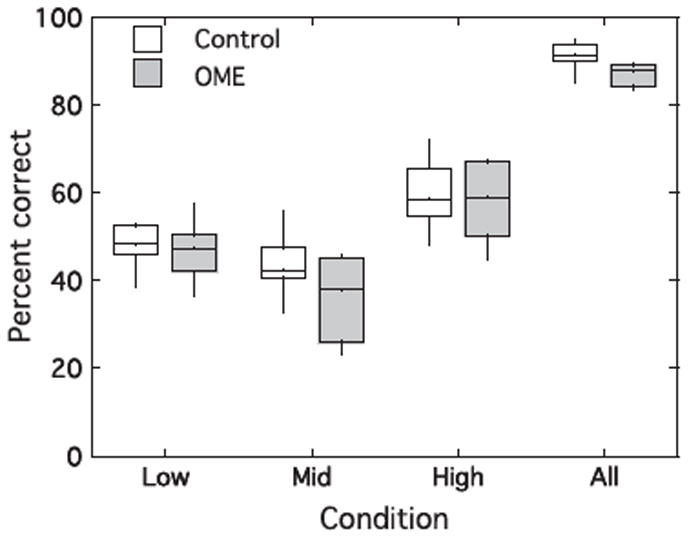
Figure 1.

A comparison of percent correct for normal hearing listeners (open rectangles) and OME listeners (shaded rectangles) in the omit-low, omit-mid, omit-high, and all-present conditions. Rectangles span the 25th to 75th percentiles, and the middle horizontal bar indicates the median. Vertical bars represent the 10th to 90th percentiles.
