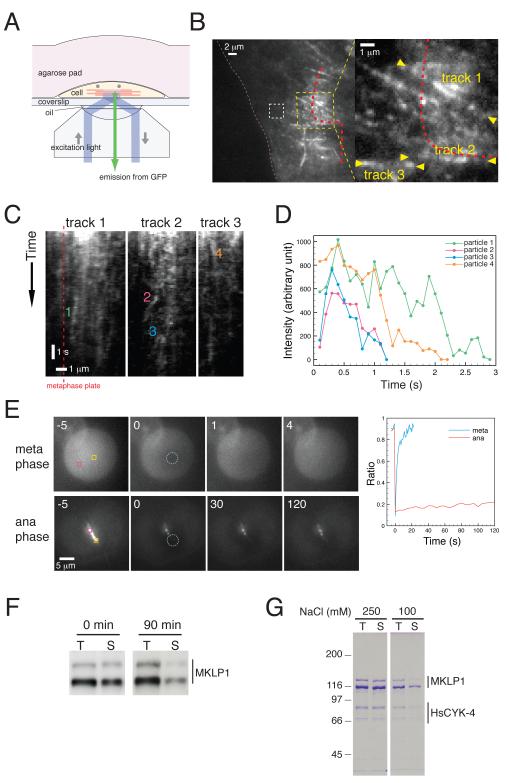
Figure 1.
Centralspindlin accumulates to the centre of the central spindle through clustering. (A-E) HeLa cells stably expressing functional HsCYK-4-GFP were observed by live imaging. (A) Schematic of the experimental setup used to observe the movement of HsCYK-4-GFP along the central spindle. (B) Image of a cell in early anaphase. The area in the left panel indicated by the yellow dotted square is shown magnified in the right panel. The plasma membrane is indicated with pink dotted lines. The position of metaphase plate (Figure S1) is indicated by a red dotted line. The white dotted square was used for background correction for fluorescence intensity in D. (C) Kymographs along microtubule tracks indicated in B. (D) Traces of the fluorescent intensity of the particles indicated in C. (E) HsCYK-4-GFP was photobleached in the areas indicated by dotted blue circles in cells in metaphase and anaphase. The ratio of the fluorescence signals in the bleached (yellow square) to the unbleached areas (magenta) was plotted. The time (sec) after photobleaching is shown. (F) Cell lysates were prepared from HeLa cells arrested at prometaphase (0 min) or 90 min after release from nocodazole. MKLP1 in total cell lysates (T) and in supernatants (S) following centrifugation was analysed by Western blotting. (G) Centralspindlin purified from HeLa cells in the presence of 250 mM NaCl was diluted into buffers containing the indicated concentration of salt. Proteins in total inputs (T) and supernatants (S) were detected by Coomassie staining after SDS-PAGE.

