Figure 4.
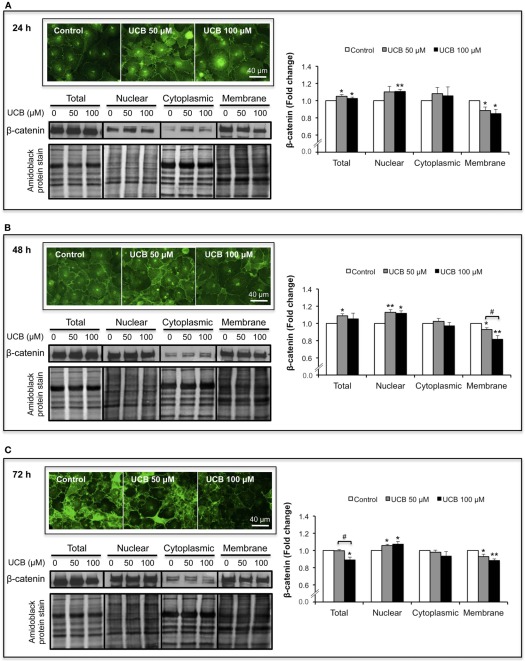
UCB interaction with the HBMEC monolayer determines an upregulation of nuclear β-catenin and a down-regulation in the membrane fraction. HBMEC line was incubated without (control) or with 50 or 100 μM UCB, in the presence of 100 μM HSA. β-catenin was evaluated by immunofluorescence and Western blot analysis of different subcellular locations (nucleus, cytoplasm, and membrane), after subcellular fractionation. Representative immunofluorescence photos, as well as representative Western blot results and respective quantification are shown for the incubation periods of 24 h (A), 48 h (B), and 72 h (C). Quantification of band intensity was done by scanning densitometry and standardized with respect to total protein stains. Results are means ± SEM from at least four independent experiments performed in duplicate. *P < 0.05 and **P < 0.01 vs. respective control; #P < 0.05 UCB 100 vs. 50 μM.

