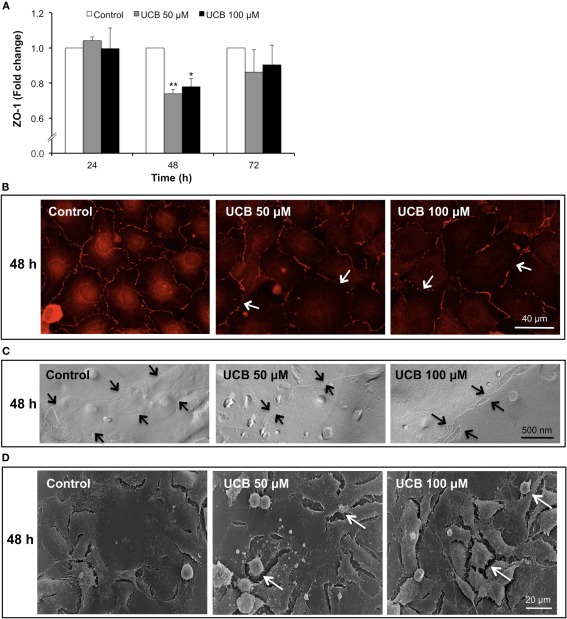
Figure 5.
Interaction of UCB with the HBMEC monolayer determines a later down-regulation of ZO-1 protein. HBMEC line was incubated without (control) or with 50 or 100 μM UCB, in the presence of 100 μM HSA, for the indicated incubation periods. Total fluorescence of ZO-1 is shown as fold change from respective control (A). Representative results, showing loss of ZO-1 staining (arrows), after a 48 h period of incubation are shown (B). UCB exposure induces loss of tight junction strands (arrows) at 48 h, as observed by freeze-fracture (C). Scanning electron microscopy results evidence the effects of UCB on the intercellular contacts after 48 h, showing retracted endothelial cells (arrows) (D). Results are means ± SEM from at least three independent experiments performed in duplicate. *P < 0.05 and **P < 0.01 vs. respective control.

