
Fig. 6.
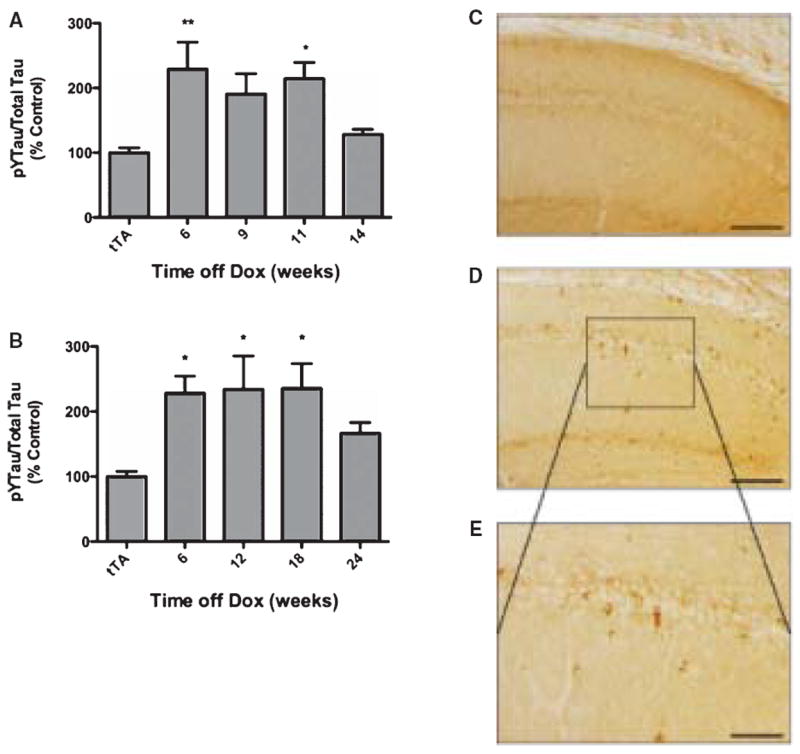
Tau hyperphosphorylation in AblPP/tTA mice. A, B) ELISA analysis of tyrosine phosphorylated (4G10) tau/total (DA9) tau in male (A) and female (B) AblPP/tTA mice. n = 4 for each timepoint. One-way ANOVA with Dunnett’s post-test was used to calculate whether AblPP/tTA mice showed significant increases in tau phosphorylation when compared to control (tTA) mice. *p < 0.05, **p < 0.01, ***p < 0.001. C–E) PHF1 staining of representative sections of AblPP/tTA mouse CA1 (D, E) versus controls (C). Scale bars = 800 μm (C, D), 400 μm (E).