
Figure 5.
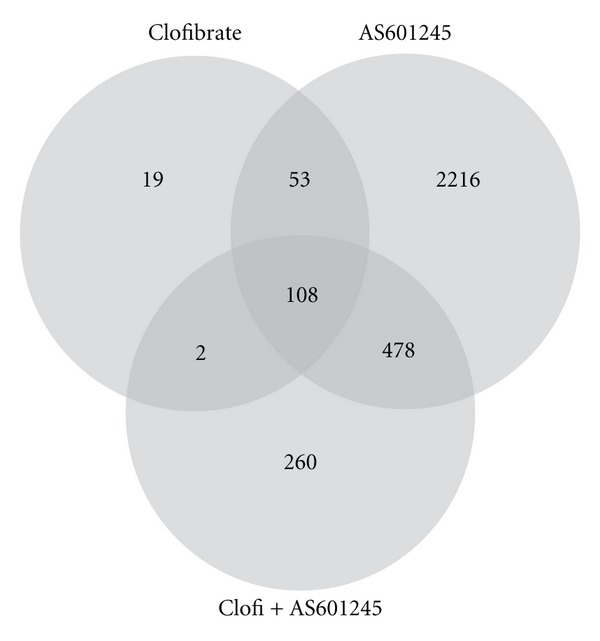
Microarray analysis of gene expression. Venn diagram derived from microarray analysis of gene expression in CaCo-2 cells treated with 5 μM clofibrate, 0.1 μM AS601245, and the association of these two compounds (Clofi + AS601245) at 24 hours. The diagram shows the number of genes modulated by the treatments.