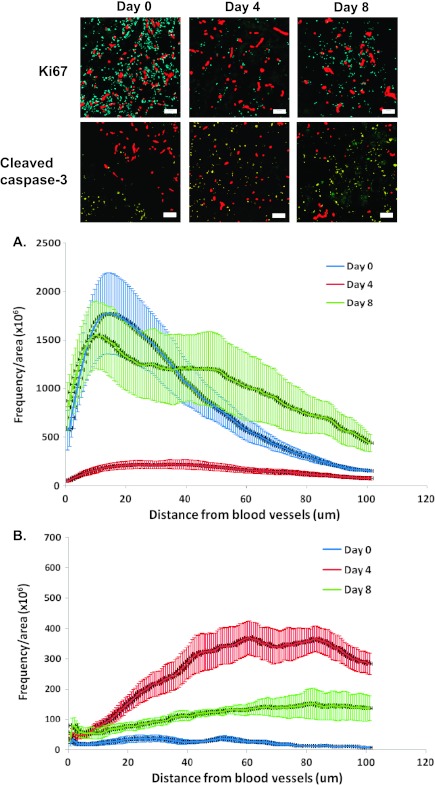
Figure 7.
The effect of gefitinib (100 mg/kg by oral gavage, 3 days of treatment) on (A) cell proliferation (Ki67) and (B) apoptosis (cleaved caspase 3) in A431 xenografts. Time is measured from the start of the gefitinib treatments (i.e., day 4 is 1 day after the last treatment). Photomicrographs: blue = Ki67, yellow = cleaved caspase 3, and red = functional blood vessels. Plots indicate the frequency of positively stained pixels in relation to distance from the nearest functional blood vessel. Lines indicate the mean of four to six tumors per treatment group; error bars, SE.

