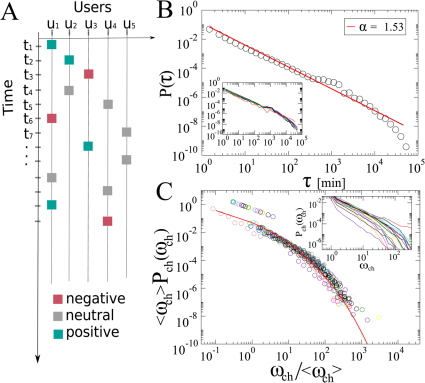
Figure 1. Communication activity over an IRC channel.
A) Schema of the evolution of a conversation in an IRC channel. At every time step, a user enters a post expressing a positive, negative, or neutral emotion. B) Probability distribution of the user activity over all the IRC channels. The activity is expressed as the time interval τ between two consecutive posts of the same user. Inset: Probability distribution of the user activity for individual IRC channels. The time is measured in minutes. C) Scaled probability distribution of the time interval ωch between consecutive posts entered in all the 20 IRC channels. The solid line represents stretched exponential fit to the data. Inset: Probability distribution of the time interval ωch between consecutive posts entered in all the 20 IRC channels without rescaling. The time is measured in minutes.

