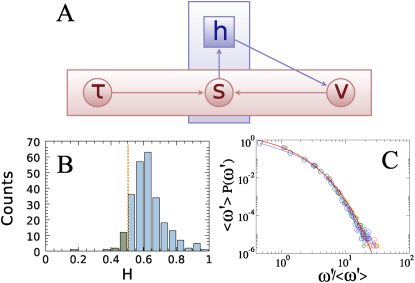
Figure 4. Modeling schema, and simulation results.
A) Schematic representation of the model: The horizontal layer represents the agent, the vertical layer the communication in the chatroom where posts are aggregated. After a time lapse τ, which follows the power-law distribution of Fig. 1B, the agents writes a post s which implicitly expresses its emotions, v. Posts read in the chatroom feed back on the emotional state v of the agent. B) Hurst exponents for the individual behavior of agents in isolation with Av ∈ [0.2, 0.5] and γv ∈ [0.2, 0.5]. Only the exponents derived with fitting quality R2 > 0.9 are considered. C) Scaled probability distribution of the time interval ω′ between consecutive posts in 10 simulations of the model. Stretched exponential fit shows similar behavior to real IRC channel data.

