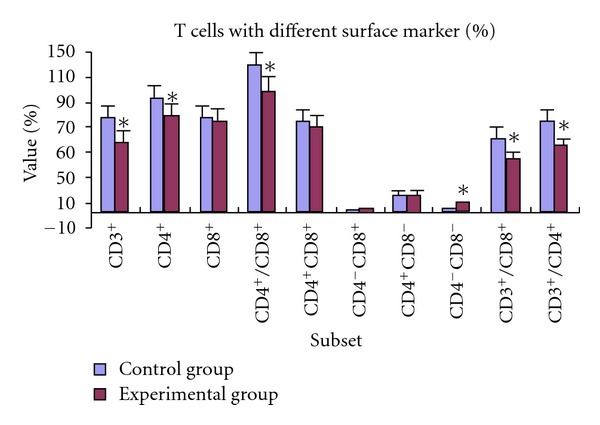
Figure 1.

We measured the percentage of T lymphocytes in blood of exposed Sprague-Dawley (SD) rats using flow cytometric analysis. Values are expressed as mean ± standard deviation, and are representative of two separate experiments with twenty rats per group in each experiment. *P < 0.05 compared to control group.
