Figure 4.
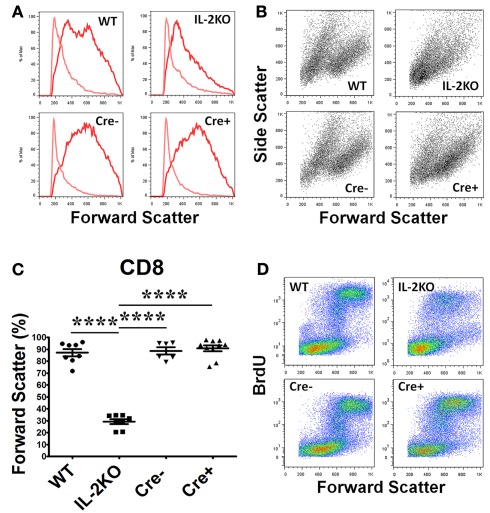
Lymphocyte blastic transformation in CD8 T cells. (A) Forward Scatter histograms and (B) Dot plots monitoring Side and Forward Scatter in CD8 T cells from WT (upper left), conventional IL-2KO (upper right), Cre− (lower left),, and conditional IL-2(−/−) Cre+ (lower right) and (C) The difference in Forward Scatter by CD4 T cells from WT (●; n = 8), conventional IL-2KO (◼; n = 8), Cre− (▾; n = 6), and conditional IL-2(−/−) Cre+ (▴; n = 10) mice (p < 0.0001). (D) Dot plots monitoring BrdU and Forward Scatter in CD8 T cells from WT (upper left), conventional IL-2KO (upper right), Cre− (lower left), and conditional IL-2(−/−) Cre+ (lower right) mice. Anti-CD3/28-activated splenocytes were cultured for 48 h. Representative histograms and Side and Forward Scatter dot plots (B) were chosen from 1 of 6–10 independent experiments, while BrdU and Forward Scatter dot plots (C) were chosen from 1 of 5–7 independent experiments. Light color histogram lines represent non-activated cells. The results are shown as Mean ± SEM (vertical brackets). Asterisks represent the level of statistical significance.

