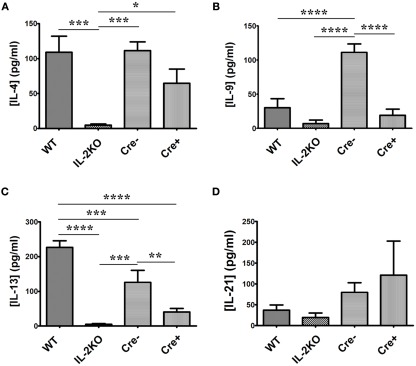
Figure 9.
IL-4, IL-9, IL-13, and IL-21 cytokine production. The difference in (A) [IL-4] (pg/ml; p = 0.001), (B) [IL-9] (p < 0.0001), (C) [IL-13] (p < 0.0001), and (D) [IL-21] (p = 0.3717) from WT, conventional IL-2KO, Cre−, and conditional IL-2(−/−) Cre+ mice upon anti-CD3/28-activation for 24 h. The Mean ± SEM (vertical brackets) results from five individual experiments are shown. Asterisks represent the level of statistical significance.

