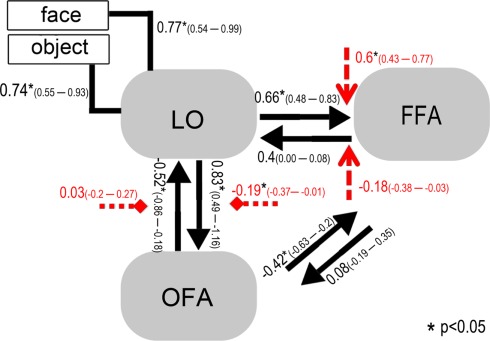
Figure 7.
The structure of the winner model. Simple lines signify the object and face input stimuli to the system (DCM.C). Black arrows show inter-regional connections (DCM.A) while the red arrows stand for the modulatory connections (DCM.B): face modulation is signified with dashed arrows, while object modulation is signified with square-head dashed arrows. Group-level averages of MAP estimates and 95% confidence intervals are illustrated. The averages were tested against 0 and significant results are signified with * if p < 0.05.

