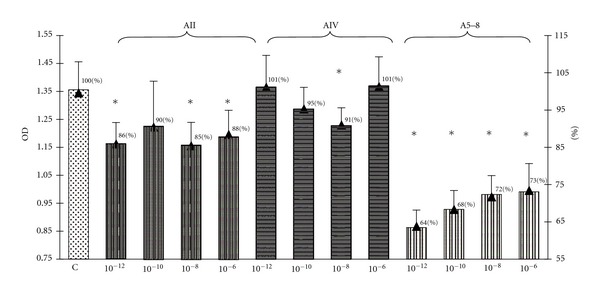
Figure 3.

The influence of 72-hrs treatment with angiotensin II (AII), angiotensin IV (AIV), and angiotensin 5–8 (A5–8) on the cellular proliferation expressed as BrdU incorporation in the lactosomatotroph GH3 cell culture. X axis: absolute values of the optical density (OD), auxiliary axis (▲): OD in the particular angiotensin-treated groups expressed as the percentage of the optical density measured at 450 nm of unstimulated cells (control (C) = 100%). X ± SEM; *P < 0.05 versus C.
