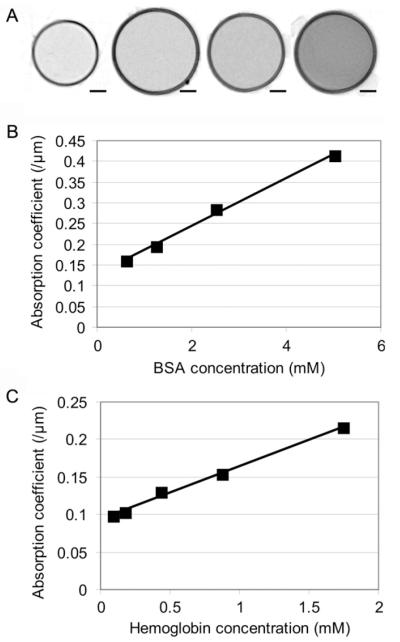
Fig.1.
Estimation of the absorption coefficients of BSA and hemoglobin. (A) Virtual z-sections through transmission X-ray tomograms of capillaries containing BSA at concentration ranging from 5 to 0.625 mM. The circular profiles represent the walls of the glass capillaries viewed in cross-section. (B and C) Absorption coefficients plotted against BSA (B) and hemoglobin (C) concentrations. The absorption curve does not go through zero due to some absorption of soft X-rays by water or PBS. Scale bars: 1 μm.

