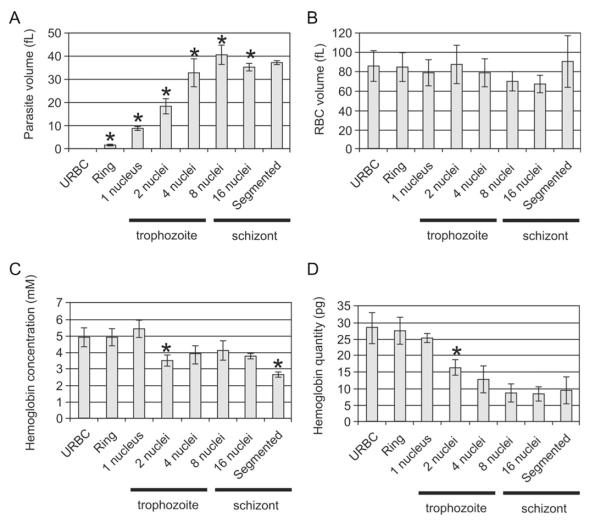
Fig.3.
Analysis of morphometric parameters for asexual stage parasites at different stages of development. The tomograms were segmented manually and the models used to estimate the volumes of the parasites (A) and the infected RBCs (B). The absorption coefficient (see Fig. 1) was applied to determine the hemoglobin concentration in the RBC cytoplasm (C). The total amount of hemoglobin (D) was calculated from the known volume and concentration. The asterisks indicate measurement that are significantly different (P < 0.05) from the value for the previous stage.

