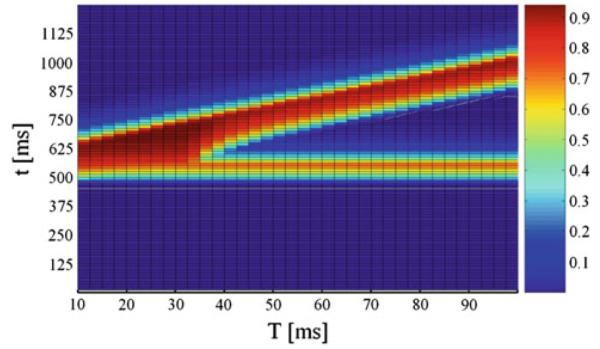
Fig. 7.

Normalized activity on unit NRPC depending on the lead time interval T and time t under modulatory factor F = 0.1. The pulse intensity was set to 85 dB and the prepulse intensity to 80 dB. On the x axis, T is the lead time interval. On the y axis, t is time
