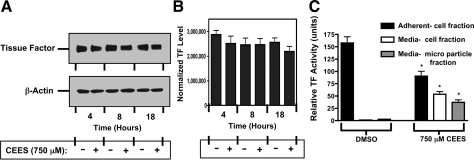
Fig. 9.
Total cellular expression of TF following CEES exposure. A: untreated or CEES-exposed (750 μM) 16HBE cells were harvested after 4, 8, or 18 h of exposure and analyzed for TF abundance by Western blot. Expression of β-actin was measured to confirm that comparable levels of protein were loaded from all samples. The blot is from a representative experiment (n = 3 repetitions). B: bars represent mean density ± SD (arbitrary units) of 3 separate blots after quantification by imaging densitometry and normalization to β-actin. No statistical difference was observed between groups as assessed by ANOVA. C: effect of CEES exposure on the release of TF. 16HBE cell cultures were exposed to DMSO or 750 μM CEES for 18 h and separated into an adherent cell (solid bar) fraction, a fraction of pelleted floating cells from media (open bar), or microparticles (shaded bar). Material in each fraction was washed and resuspended at equal volume and assayed for TF as described in methods. Data are the means ± SD for 4 determinations. * P < 0.05 compared with corresponding DMSO control.

