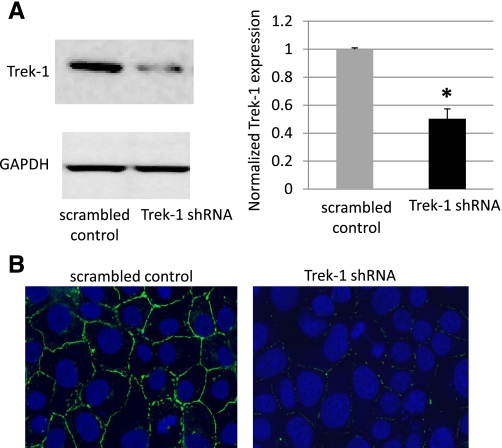
Fig. 5.
Targeted knockdown of Trek-1 expression in shRNA-transfected MLE-12 cells. A: decreased Trek-1 expression in shRNA-treated cells in a representative Western blot and a 50% decrease in Trek-1 expression using densitometry analysis (n = 10, *P < 0.05). GAPDH was used a loading control. B: decreased Trek-1 immunofluorescence (green) using confocal microscopy in shRNA-transfected MLE-12 cells (magnification ×100). Nuclei were counterstained with DRAQ5 (blue).

